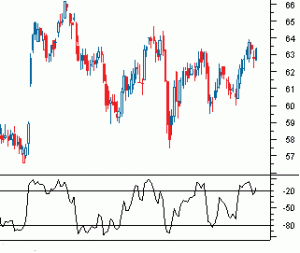
Williams %R, is a technical analysis oscillator showing the current closing price in relation to the high and low of the past N days (for a given N). It was developed by trader and author Larry Williams and is used in the stock and commodities markets.
The indicator is very similar to Stochastic %K – except that Williams %R is plotted using negative values ranging from 0 to -100.
The number of periods used to calculate Williams %R can be varied according to the time frame that you are trading. A rule of thumb is that the indicator window should be half the length of the cycle (14 days is popular for the intermediate cycle).
Overbought and Oversold levels are normally set at -20 and -80.
t is used to determine market entry and exit points. The Williams %R produces values from 0 to -100, a reading over 80 usually indicates a stock is oversold, while readings below 20 suggests a stock is overbought.
How Williams %R is created.
William %R shows the relationship of the close relative to the high-low range over a set period of time. The nearer the close is to the top of the range, the nearer to zero (higher) the indicator will be.
The nearer the close is to the bottom of the range, the nearer to -100 (lower) the indicator will be. If the close equals the high of the high-low range, then the indicator will show 0 (the highest reading).
If the close equals the low of the high-low range, then the result will be -100 (the lowest reading).
It is important to remember that overbought does not necessarily imply time to sell, and oversold does not necessarily imply time to buy. A security can be in a downtrend, become oversold and remain oversold as the price continues to trend lower. Once a security becomes overbought or oversold, traders should wait for a signal that a price reversal has occurred.
As always, price reversal confirmation can also be accomplished by using other indicators or aspects of technical analysis with Williams %R.
One method of using Williams %R might be to identify the underlying trend and then look for trading opportunities in the direction of the trend. In an uptrend, traders may look to oversold readings to establish long positions. In a downtrend, traders may look to overbought readings to establish short positions.
