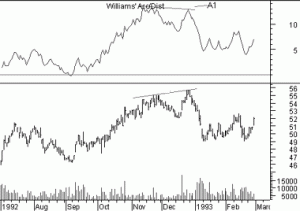
The Williams’ Accumulation/ Distribution indicator, developed by Larry Williams, aims to reflect whether the market is controlled by buyers (accumulation) or by sellers (distribution).
Prices making a new low along with the A/D indicator failing to reach a new low suggest that accumulation is taking place and creates a buy signal. Prices making a new high and the indicator failing to make new highs suggest distribution is taking place and creates a sell signal.
Interpretation
- Distribution of the security is indicated when the security is making a new high and the A/D indicator is failing to make a new high. Sell.
- Accumulation of the security is indicated when the security is making a new low and the A/D indicator is failing to make a new low. Buy.
Calculation
To calculate Williams’ Accumulation/Distribution indicator, first determine the True Range High (“TRH”) and True Range Low (“TRL”).
Today’s accumulation/distribution is then determined by comparing today’s closing price to yesterday’s closing price.
If today’s close is greater than yesterday’s close:
Today’s A/D = Today’s close – TRL
If today’s close is less than yesterday’s close:
Today’s A/D = Today’s close – TRH
If today’s close is equal to yesterday’s close:
Today’s A/D = 0
The Williams’ Accumulation/Distribution indicator is a cummulative total of these daily values.
Williams A/D = Today’s A/D + Yesterday’s Williams A/D
