Overview
The Accumulation Swing Index is a cumulative total of the Swing Index. The Accumulation Swing Index was developed by Welles Wilder.It was created as an ordinary fluctuations indicator that gets signals from previous maximums and minimums of price
Interpretation
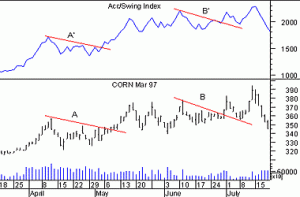
The Accumulation Swing Index attempts to show this phantom line. Since the Accumulation Swing Index attempts to show the “real market,” it closely resembles prices themselves. This allows you to use classic support/resistance analysis on the Index itself. Typical analysis involves looking for breakouts, new highs and lows, and divergen.
Following are the characteristics of the Accumulation Swing Index:
1. It provides a numerical value that quantifies price swings.
2. It defines short-term swing points.
3. It cuts through the maze of high, low, and close prices and indicates the real strength and direction of the market.
How It Is Calculated?
The Accumulation Swing Index is a cumulative total of the Swing Index. The Swing Index and the Accumulation Swing Index require opening prices.
Step-by-step instructions on calculating the Swing Index are provided in Wilder’s book, New Concepts In Technical Trading Systems.
A breakout is indicated when the Accumulation Swing Index exceeds its value on the day when a previous significant high swing point was made. A downside breakout is indicated when the value of the Accumulation Swing Index drops below its value on a day when previous significant low swing point was made. You can confirm trend line breakouts by comparing trend lines on the Accumulation Swing Index to trend lines on the price chart. A false breakout is indicated when a trend line, drawn on a price chart is penetrated, but a similar trend line, drawn on the Accumulation Swing Index is not penetrated
Example
