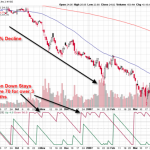
OVERVIEW The Aroon indicator anticipates when a security is changing from an impulsive move to a trading range and vice versa. The Aroon indicator was developed by Tushar Chande, who also created the Chande Momentum Oscillator and the Qstick. The aroon indicator displays two plots: (1) Aroon Up and (2) Aroon Down. The standard period for the Aroon Up and Aroon Down is … [Read more...]
Accumulation/Distribution -Technical Indicator
Overview Accumulation/Distribution Technical Indicator is determined by the changes in price and volume. The volume acts as a weighting coefficient at the change of price — the higher the coefficient (the volume) is, the greater the contribution of the price change (for this period of time) will be in the value of the indicator. In fact, this indicator is a variant of the … [Read more...]
Technical Indicator- Moving Average used in Indian stock market
MOVING AVERAGE The concept of moving average in statistics is used to analyze the time series data. Moving averages simply measure the average price or exchange rate of a currency pair over a specific time frame. For example, if we take the closing prices of the last 10 days, add them together and divide the result by 10, we have created a 10-day simple moving … [Read more...]
Average Directional Movement Index Technical Indicator (ADX)
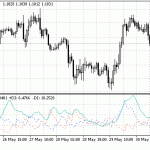
Average Directional Movement Index Technical Indicator (ADX) helps to determine if there is a price trend. It was developed and described in detail by Welles Wilder in his book "New concepts in technical trading systems". However, the main purpose of the ADX is to determine whether a stock, future, or currency pair is trending or is in a trading range. Determining which mode a … [Read more...]


