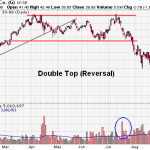
It is a charting pattern used in technical analysis. It describes the drop of a stock (or index), a rebound, another drop to the same (or similar) level as the original drop, and finally another rebound.As its name implies, the pattern is made up of two consecutive troughs that are roughly equal, with a moderate peak in-between. The double bottom is a major reversal pattern … [Read more...]
