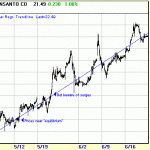
A Linear Regression Trendline is a straight line drawn through a chart of a security's prices using the least squares method, and it is used to forecast future trends. A Linear Regression trendline uses the least squares method to plot a straight line through prices so as to minimize the distances between the prices and the resulting trendline.A Linear Regression trendline is … [Read more...]
Linear Regression Indicator
The Linear Regression Indicator plots the trend of a market instrument's price over a specified length of time. The trend is determined by calculating a Linear Regression Trendline using the "least squares fit" method. This method helps to minimum distance between the data points and a Linear Regression Trendline. Unlike the straight Linear Regression Trendline, the Linear … [Read more...]

