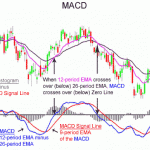
MACD, stands for Moving Average Convergence / Divergence, is a technical analysis indicator .It shows the difference between a fast and slow exponential moving average (EMA) of closing prices. During the 1980s MACD proved to be a valuable tool for any trader. MACD is a trend following indicator, and is designed to identify trend changes. It’s generally not recommended for … [Read more...]
DMI, Directional Momentum Index
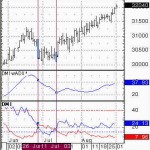
Directional Momentum Index ,DMI.is an indicator used in technical analysis to determine if a financial instrument, such as a stock, is trending in particular direction. It is broken into the positive directional indicator (+DI), negative directional indicator (-DI) and Average Directional Index (ADX). The value of the index can be zero. The higher the value of the DMI, the … [Read more...]
TRIX: Momentum indicator
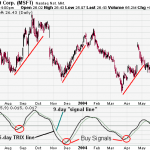
Introduction TRIX is a momentum indicator that displays the percent rate-of-change of a triple exponentially smoothed moving average of a security's closing price. It was developed in the early 1980's by Jack Hutson, an editor for Technical Analysis of Stocks and Commodities magazine. Oscillating around a zero line, TRIX is designed to filter out stock movements that are … [Read more...]
Moving Average Convergence / Divergence(MACD)
MACD, stands for Moving Average Convergence / Divergence, is a technical analysis indicator .It shows the difference between a fast and slow exponential moving average (EMA) of closing prices. During the 1980s MACD proved to be a valuable tool for any trader. MACD is a trend following indicator, and is designed to identify trend changes. It's generally not recommended … [Read more...]


