Williams %R, is a technical analysis oscillator showing the current closing price in relation to the high and low of the past N days (for a given N). It was developed by trader and author Larry Williams and is used in the stock and commodities markets. The indicator is very similar to Stochastic %K - except that Williams %R is plotted using negative values ranging from 0 to … [Read more...]
Cutler’s RSI : Relative Strength Index
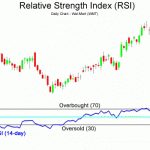
Cutler's RSI which is another kind of Welles Wilder's original Relative Strength Index turns out to be a momentum oscillator used to find and demonstrate overbought and oversold conditions. It does so by keying on special levels - usually 30 and 70 - on a "0 to 100-chart". The Relative Strength Index (RSI) is a financial technical analysis momentum oscillator measuring the … [Read more...]
Relative Momentum Index Explained ( RMI Indicator )
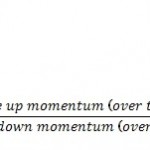
The Relative Momentum Index function determines the internal momentum of a field using the number of upward and downward price changes across a given number of bars over a given period of time. The Relative Momentum Index is based on a ratio of the average upward changes to the average downward changes over a given period of time. The individual changes are calculated for … [Read more...]

