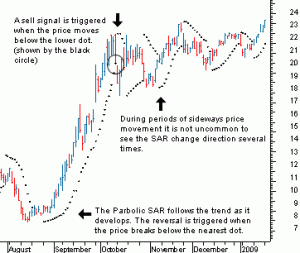
The parabolic SAR is a technical indicator that is used by many traders to determine the direction of an asset’s momentum and the point in time when this momentum has a higher-than-normal probability of switching directions. Sometimes known as the “stop and reversal system”, the parabolic SAR was developed by the famous technician Welles Wilder, creator of the relative strength index, and it is shown as a series of dots placed either above or below an asset’s price on a chart.
This method was developed by J. Wells Wilder. Basically, if the stock is trading below the parabolic SAR (PSAR) you should sell. If the stock price is above the SAR then you should buy (or stay long).
Parabolic SAR should only be employed in trending markets – when it provides useful entry and exit points. It is plotted in a rather unorthodox fashion: a stop loss is calculated for each day using the previous days data. The advantage is that the stop level can be calculated in advance of the market opening.
Parabolic SAR introduces some excellent concepts to technical analysis but leaves two major weaknesses:
1. Trend speeds vary over time and between stocks. It is difficult to arrive at one acceleration factor that suits all trends — it will be too slow for some and too fast for others.
2. The SAR system assumes that the trend changes every time a stop has been hit. Any trader will tell you that your stops may be hit several times while the trend continues. Price merely retraces through your stop and then resumes the up-trend, leaving you lagging behind.
The Parabolic SAR is an outstanding indicator for providing exit points. Long positions should be closed when the price sinks below the SAR line, short positions should be closed when the price rises above the SAR line. It is often the case that the indicator serves as a trailing stop line.
