Introduction
Moving averages are one of the most popular and easy to use tools available to the technical analyst. They smooth a data series and make it easier to spot trends, something that is especially helpful in volatile markets. They also form the building blocks for many other technical indicators and overlays.
It is a method of calculating the average value of a security’s price, or indicator, over a period of time. The term “moving” implies, and rightly so, that the average changes or moves. When calculating a moving average, a mathematical analysis of the security’s average value over a predetermined time period is made.As the security’s price changes over time, its average price moves up or down.
The two most popular types of moving averages are the Simple Moving Average (SMA) and the Exponential Moving Average (EMA).
There are several different types of moving averages, each with their own peculiarities.
* Simple moving averages are the easiest to construct, but also the most prone to distortion.
* Weighted moving averages are difficult to construct, but reliable.
* Exponential moving averages achieve the benefits of weighting combined with ease of construction.
* Wilder moving averages are used mainly in indicators
Uses for Moving Averages
There are many uses for moving averages, but three basic uses stand out:
- Trend identification/confirmation
- Support and Resistance level identification/confirmation
- Trading Systems
There are three ways to identify the direction of the trend with moving averages:
- Direction,
- Location
- Crossovers.
Moving Average demonstrates the average value of a security’s price in a time frame. The average price shifts up or down when the security’s price shifts.
Simple moving averages provide the same weight to all the prices. Triangular averages provide more weight to prices in the middle of the time period. Exponential and weighted averages provide more weight to recent prices.
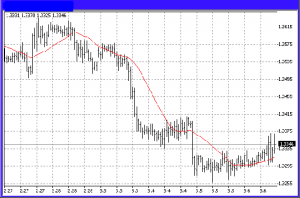
To interpret a moving average usually you should just compare the links between a moving average of the security’s price with the security’s price itself. If the security’s price rises above its moving average a purchase signal is generated. If the security’s price shifts below its moving average a sell signal is generated.
In other words, the interpretation of an indicator’s moving average is the same as the interpretation of a security’s moving average. Once the indicator moves below its moving average, it means a long-lasting downward movement by the indicator, and if the indicator moves above its moving average, it means a long-lasting upward movement by the indicator.

plss details..wat is the proper entry any stock