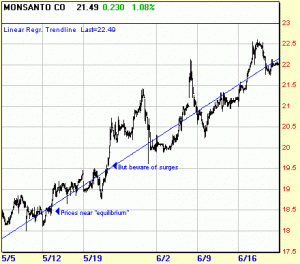
A Linear Regression Trendline is a straight line drawn through a chart of a security’s prices using the least squares method, and it is used to forecast future trends.
A Linear Regression trendline uses the least squares method to plot a straight line through prices so as to minimize the distances between the prices and the resulting trendline.A Linear Regression trendline is simply a trendline drawn between two points using the least squares fit method. The trendline is displayed in the exact middle of the prices. If you think of this trendline as the “equilibrium” price, any move above or below the trendline indicates overzealous buyers or sellers.
A Linear Regression trendline shows where equilibrium exists. Raff Regression Channels show the range prices can be expected to deviate from a Linear Regression trendline.

Great writter, Thanks for delivering the prestigious post. I found it useful. Kind regards !!