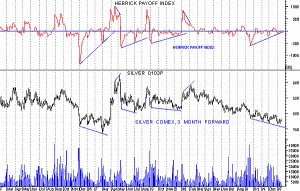
John Herrick developed the Herrick Payoff Index. It tracks volume, price and open interest into an aggregate value that is meant to capture trends and their reversals. HPI uses daily high and low prices, volume and open interest – preferably of all contracts from a period of at least three weeks. HPI applies these to prices of the most active delivery month. Instead of using closing prices, the HPI measures mean prices. Simply, when volume increases, the absolute value of the HPI also increases.
Further, a rising open interest is a bullish signal in an uptrend and a bearish signal in a downtrend. Conversely, a falling open interest is a bearish signal in an uptrend and a bullish signal in a downtrend. A flat open interest is neutral. We can apply these principles to the HPI: when it breaks its longer-term trend line, it gives a leading signal, indicating that a price trend is likely to be broken through. When HPI crosses its center line, the price trend is confirmed.
But you can extend these principles further: when prices reach a new low but the HPI records a higher volume than a previous decline, a buy signal is issued, which is a bullish divergence. When the HPI turns up from this second bottom, the trader has an opportunity to place a protective stop below the latest low price. The corresponding bearish divergence occurs when prices hit a new high, but the HPI reaches a lower top. The short-sell signal occurs when the HPI turns down, so the trader would use a stop above the latest high. The Herrick Payoff Index is an excellent indicator of the market’s overall bullishness or bearishness. When the HPI is above its center line, bulls are in control. When the HPI lies below the center, a trader would be wise to sell short.
