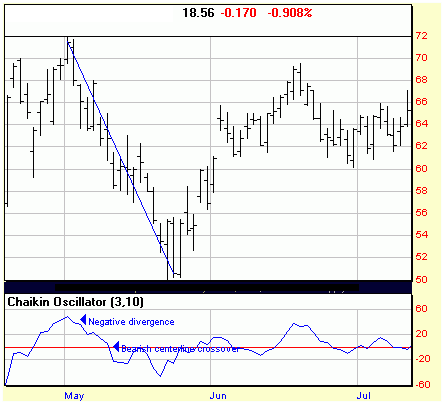
The Chaikin Oscillator, or Chaikin A/D Oscillator, stems from the concept behind the Accumulation/Distribution Line. The basic premise of the Chaikin Oscillator (and the A/D Line) is that the degree of buying or selling pressure can be calculated by the location of a close relative to the high and low for the corresponding period. There is a buying pressure when a stock closes in the upper half of a period’s range and there is a selling pressure when a stock closes in the lower half of the period’s trading range.
The Chaikin Oscillator is created by subtracting a 10-period exponential moving average of the Accumulation/Distribution Line from a 3-period exponential moving average of the Accumulation/Distribution Line
The Chaikin Oscillator may be an excellent tool for generating buy and sell signals when its action is compared to price movement. However, because the Chaikin Oscillator is an indicator of an indicator, it is prudent to look for confirmation of a positive or negative divergence, say a moving average crossover, before counting this as a signal.
Two bullish signals that can be generated from the Chaikin Oscillator: positive divergences and bullish centerline crossovers. Two bearish signals that can be generated from the Chaikin Oscillator: a negative divergence and a bearish centerline crossover.
