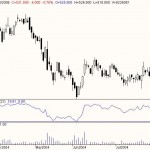
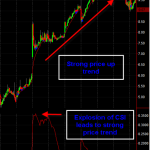
Mr. Sibbet defined six "rules" for the Demand Index: 1. A divergence between the Demand Index and prices suggests an approaching weakness in price. 2. Prices often rally to new highs following an extreme peak in the Demand Index (the Index is performing as a leading indicator). 3. Higher prices with a lower Demand Index peak usually coincides with an important top (the … [Read more...]
Demand Index : The Concept
The Demand Index is a combination of price and volume that appears to provide predictions of price changes. There are 6 rules when using the demand index:- weakness in price follows divergence between the demand index and price; after extreme peaks in the demand index, prices usually rally to new highs; tops are signalled by high prices and low demand index values; if the … [Read more...]
Application Of Correlation Index
This index reflects the market view of the future level of the market portfolio diversification. This study proposes an innovative methodology for backing-out implied correlation measures from index options.The methodology is applied to the Dow Jones Industrial Average index and the statistical properties and the dynamics of the proposed implied correlation measure are … [Read more...]
Correlation Index : The Basic Concept
This is an "Average" correlation derived from the Basket IV formula. The "Basket IV" can be derived from the actual market prices of the Index option. In the term on the right, you get the correlation of every existing pair of stock component. If you replace these corr(i,j) terms by only one term CORR assuming they are the same, then you can extract this in front of the … [Read more...]
Commodity Selection Index: Application and Charts
Commodit Selection Index as an indicator is an extension of DMI. This indicator can help traders to properly select instruments for investment. The selection is based on DMI indicator with considering of capital, leverage, and comission fee. A high CSI rating indicates that the commodity has strong trending and volatility characteristics. The trending characteristics are … [Read more...]