By definition, The Dynamic momentum index is an indicator used in technical analysis that determines overbought and oversold conditions of a particular asset. This indicator is very similar to the relative strength index (RSI). The main difference between the two is that the RSI uses a fixed number of time periods (usually 14), while the dynamic momentum index uses different … [Read more...]
Directional Movement Index : Application and Chart
Further calculation of the True range is necessary to calculate the Directional Indicators (+DI and -DI). The true range is always positive. It is defined as the current highest value of the difference among today’s highest price minus today’s lowest price; today’s highest price minus yesterday’s closing price; and today’s lowest price minus yesterday’s closing price. Wilder, … [Read more...]
Directional Movement Index : The Concept
The Directional Movement Index is also known as DMI. DMI is a momentum indicator . It is calculated using the price. It first compares the current price with the previous price range, and displays the result as an upward movement line (+DI), and a downward movement line (-DI), between 0 and 100. The DMI also helps in calculating the strength of the upward or downward movement, … [Read more...]
Application Of Detrended Price Oscillators
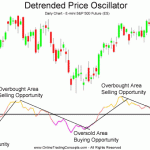
The Detrended Price Oscillator has several uses and interpretations, primarily designed to take advantage of overbought and oversold conditions within part of a large trend: One interpretation is to identify past oversold and overbought conditions in the price chart, and use that as a baseline for what is considered overbought and oversold. For example, let’s say … [Read more...]
Detrended Price Oscillator:Basic Concept
The Detrended Price Oscillator attempts to filter out trend in order to focus on the underlying cycles of price movement. To accomplish this, the moving average (generally 14-period) becomes a straight line and price variation above and below the moving average becomes the Price Oscillator. The Detrended Price Oscillator technical indicator can show overbought or oversold … [Read more...]
