Mass Index was developed by Donald Dorsey in order to catch the trend reversal points. The daily prices movements are used for this purpose. In case the movement is considerable the Mass Index goes up, otherwise if it is slight the Mass Index goes down.The Mass Index is used to warn of a future price reversal. The theory behind the Mass Index is that reversals occur when the … [Read more...]
Herrick Payoff Index – The Concept
The Herrick Payoff Index (HPI) uses volume, open inerest, and price to signal bullish and bearish divergences in the price of a future or options contract. The use of open interest in the calculation of the HPI means the indicator can only be used with futures and options. The HPI is based off of two premises regarding open interest: 1. Rising Open Interest: When prices rise … [Read more...]
Application and Chart of Ulcer Index
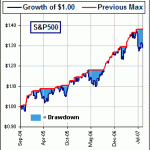
This tool is often used in conjunction with other risk measurements such as standard deviation. Investors who are risk averse should probably stay away from securities with high UI values because, if these securities experience a severe decline, they are unlikely to recover in the near future. Since the ulcer index measures change from a recent peak, it is more practical to … [Read more...]
Ulcer Index -The Basic Concept
The Ulcer Index measures the "stress" of holding a trade or investment by measuring price retracements. The Ulcer Index is based on the notion that downward volatility is bad, but upward volatility is good. Unlike standard deviation, the financial industry's benchmark way of measuring the risk of a stock, which equally weights both violent increases to the upside (upside … [Read more...]
Application of MACD in Stock Market
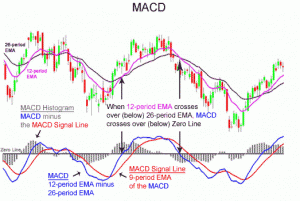
MACD Calculation The standard periods originally published by Gerald Appel are 12 and 26 days: A trend-following momentum indicator that shows the relationship between two moving averages of prices. The MACD is calculated by subtracting the 26-day exponential moving average (EMA) from the 12-day EMA. A nine-day EMA of the MACD, called the "signal line", is then plotted on … [Read more...]

