MACD Calculation
The standard periods originally published by Gerald Appel are 12 and 26 days:
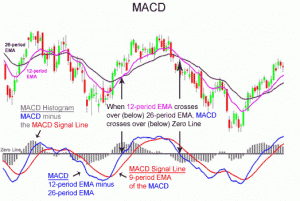
A trend-following momentum indicator that shows the relationship between two moving averages of prices. The MACD is calculated by subtracting the 26-day exponential moving average (EMA) from the 12-day EMA. A nine-day EMA of the MACD, called the “signal line”, is then plotted on top of the MACD, functioning as a trigger for buy and sell signals.
A signal line (or trigger line) is then formed by smoothing this with a further EMA. The standard period for this is 9 days,
The difference between the MACD and the signal line is often calculated and shown not as a line, but a solid block histogram style. This construction was made by Thomas Aspray in 1986. The calculation is simply
![MACD = EMA[12]\,of\,price - EMA[26]\,of\,price](http://upload.wikimedia.org/math/e/6/5/e652f873b1b6c926901af35e1aaa41aa.png)
![signal = EMA[9]\,of\,MACD](http://upload.wikimedia.org/math/4/d/f/4dfa67429145ea396d5ee5df7c674799.png)
