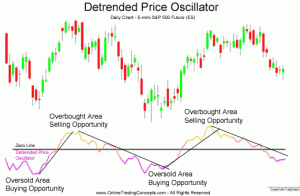
The Detrended Price Oscillator has several uses and interpretations, primarily designed to take advantage of overbought and oversold conditions within part of a large trend:
One interpretation is to identify past oversold and overbought conditions in the price chart, and use that as a baseline for what is considered overbought and oversold.
For example, let’s say overbought conditions are at +1.5 and oversold conditions are at -1.5. When the indicator goes above 1.5 and then dips back below, it could be considered overbought and trending downwards as an intermediate trend within an overall larger trend. Conversely, when the indicator goes below -1.5 and then spikes above, it could be considered oversold and trending upwards as an intermediate trend within an overall larger trend.
A second interpretation is to look for divergences in DTO vs. the main price chart or against a longer moving average. If peaks or valleys in the DTO are higher or lower then they are in the main price chart or longer moving average, it could indicate an intermediate trend change. A higher valley or trough could indicate a bullish trend while a lower peak could indicate a bearish trend.
Finally, some traders simply use a crossover of 0 as indication of a trend change.
Calculation
To calculate DPO you should take a certain period. Remove cycles that are longer than the chosen period from price dynamics, and leave shorter cycles. Half of the cycle’s length is used for smoothing. We recommend using a period of 21 or less.
The bounds (overbought/oversold levels) come from the history of previous behavior of prices. It is recommended to stand in a long position if DPO first falls below the resale level and then gets above it. Crossing of the zero point from above followed by a rise above that level is also a signal for opening a long position. Everything is vice versa for short positions.
The DPO is calculated by subtracting the simple moving average over an N day period and shifted N/2+1 days back from the price.
To calculate the Detrended Price Oscillator:
Decide on the time frame that you wish to analyze. Set n as half of that cycle period.
Calculate a simple moving average for n periods.
Calculate (n / 2 + 1)
Subtract the moving average, from (n / 2 + 1) days ago, from the closing price:
DPO = Close – Simple moving average [from (n / 2 + 1) days ago]
