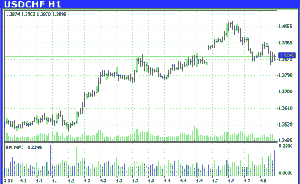
The Parameter to calculate MFI
High The high price of the security for each given day.
Low The low price of the security for each given day.
Volume The number of shares of the security that were traded during each given day.
Note that while this function is intended for use with these specific values, any values can be used for these parameters, including other price values and averaged prices.
The Market Facilitation Index analyzes the amount that the price is changing for each unit of volume. It does not include any information concerning the direction of price changes. Instead, it is used to determine the efficiency with which the price is changing.
Changes in the value of this index are typically compared to changes in volume to determine the interest that the market has in the current price trend. Four possible combinations can occur, each with its own label.
Index Up, Volume Up (Green)
The market is moving primarily in one direction and more people are participating in the market. This is a good time to already be in the market in the direction that prices are moving.
Index Down, Volume Down (Fade)
The market is idling, typically due to fading interest. Often, this occurs towards the end of a trend. However, the direction of a next new trend could be in either direction.
Index Up, Volume Down (Fake)
The market is moving primarily in one direction, but there are no new participants generating additional volume. While less volume is moving the price, the activity may be generated primarily on the floor, faking the actual off-floor market sentiment.
Index Down, Volume Up (Squat)
The volume is increasing, indicating more trading, but the price is not moving as strongly in the same direction. This typically occurs prior to a significant move in the opposite direction. Close attention should be paid to the direction the price moves when breaking out of this slowdown.
