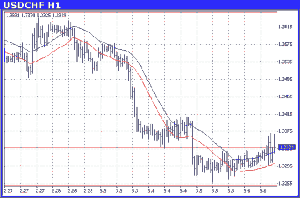
Envelopes are used to indicate the trading range of a given market above and below an average price. Basically, moving average envelopes or trading bands are calculated by taking a moving average and calculating upper and lower trading bands as a fixed percentage above and below the moving average respectively.
These are considered to suggest extreme overbought or oversold conditions. The assumption is that, price should not deviate from the average of the underlying price element (high or low) by the percentage utilized.
The first rule is – do not enter a trade when the price is within the band. A trade is signaled only when the price moves outside the band. The general policy is to go long when the price is above the band, and to go short when the price is below the band.
The second rule is for confirmation – don’t trade when the 15 exponential moving average is flat. Only trade when the 15 exponential moving average starts rising or falling in the direction of the trade.
This method keeps you out of the market when there is consolidation, which means more chances of getting whipsawed.
The chart below, clearly shows that price was within the band for the first part of the chart and entering a trade here would have got you whipsawed. As a matter of fact, the EUR/USD was in a major uptrend on the daily charts at this time and this method gave us a precise point to enter the trade on a lower time frame.
It’s the market inconstancy which defines the assortment of the best corresponding number of band margins moving. The higher this inconstancy is, the stronger the move becomes. Purchase signal occurs if the price attains the lower margin. Selling signal occurs if the price attains the upper margin of the band.
Envelopes also determine the upper and lower borders of a security’s ordinary trading range. It’s a sell signal if the security attains the upper band whereas a purchase signal if it moves to the lower boundary. It’s the security volatility range which influences the preferable percentage move (the more inconstant, the bigger the percentage).
The Envelopes interpretation resembles the interpretation of Bollinger Bands as too fervent dealers make the price move to the extremes – for example, the upper and lower bands – at which point the prices are often fixed by moving to more optimum points.
