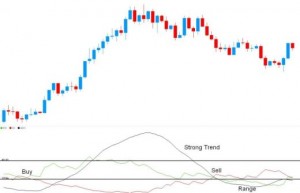
Average Directional Index is an indicator which fluctuates between 0 and 100. Readings below 20 indicate a weak trend and readings above 40 indicate a strong trend. ADX does indicates just the strength of the trend, up or down.
With ADX there are two lines which are often plotted, that indicate direction. The lines are +DI (positive directional indicator) and -DI (negative directional indicator). If the +DI line is above the -DI line, then the trend is considered bullish. Crosses of the +DI and -DI lines generate buy and sell signals.
Average Directional Index – Formula
ADX = modify moving average of DX
DX = 100 x ( (+DI – -DI)/( +DI + -DI) )
+DI = +DMn / TRn , -DI = -DM / TRn
+DM = Ht – Ht-1 , -DM = Lt – Lt-1
CL = Ct – Ct-1
TR = largest of +DM,-DM ,and CL
where :
+DI = current positive directional index
-DI = current negative directional index
+DMn = current modified moving average of +DM
+DM = current positive directional movement value
Ht = current high
Ht-1 = previous high
Lt = current low
Lt-1 = previous low
-DMn = current modified moving average of -DM
-DM = current negative directional movement value
TRn = current modified modified moving average of the true range
TR = true range
n = number of periods
DX = current DX
Implementation
A move below 40 from above indicates that the trend is slowing. Since most option strategies rely on large price movements in short timeframes, a slowing trend is bad. Therefore an ADX move below 40 would indicate that it is time to close positions.
Conversely, an ADX indicator move above 20 from below indicates that the sideways trading is over, and a new trend is developing. This would indicate that it is time to make a move, either bullish or bearish.
Also, signals can be obtained by looking at where the positive directional index +DI (green) and negative directional index -DI (red) lines cross each other. When the +DI crosses above the -DI from below, it is a bullish signal. When the -DI crosses above the +DI from below, it is bearish.
