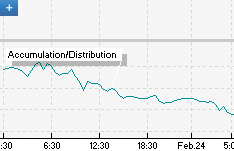
Overview
Accumulation/Distribution Technical Indicator is determined by the changes in price and volume. The volume acts as a weighting coefficient at the change of price — the higher the coefficient (the volume) is, the greater the contribution of the price change (for this period of time) will be in the value of the indicator.
In fact, this indicator is a variant of the more commonly used indicator On Balance Volume. They are both used to confirm price changes by means of measuring the respective volume of sales.
With reference to stocks, “volume” typically reflects the amount of shares traded in a particular stock and is a direct reflection of the money flowing into and out of the stock. However, it’s very important to note that in the foreign exchange (FOREX) market there is no central exchange. Therefore, there can be no true measure of actual money (volume) being trading in a particular currency instrument. Many FOREX brokers and charting software packages substitute what is becoming commonly referred to as “tick volume” for actual “money volume”. Tick volume is simply the amount of incoming price change received during a particular chart interval (bar).
When the Accumulation/Distribution indicator grows, it means accumulation (buying) of a particular security, as the overwhelming share of the sales volume is related to an upward trend of prices. When the indicator drops, it means distribution (selling) of the security, as most of sales take place during the downward price movement.
Divergences between the Accumulation/Distribution indicator and the price of the security indicate the upcoming change of prices. As a rule, in case of such divergences, the price tendency moves in the direction in which the indicator moves. Thus, if the indicator is growing, and the price of the security is dropping, a turnaround of price should be expected.
Accumulation is a market controlled by buyers, distribution is a market controlled by sellers. The Williams Accumulation/Distribution indicator is usually traded on divergences as follows:- Distribution is suggested by the stock making new highs and yet the A/D indicator is failing to make a new high, so you therefore sell. Accumulation is suggested by the stock making new lows and yet the A/D indicator is failing to make a new low, so you buy. Day trading with this indicator is impossible due to the timescale needed to acquire the data (daily). There is no evidence that the indicator works on any shorter timeframe.

Interpretation
As a volume indicator, the A/D indicator helps to determine if volume is increasing or decreasing as price is rising or falling. Signals are typically generated using the Accumlation/Distribution indicator by looking for positive and negative divergences between the A/D line and price. The A/D indicator can also be used as a measure of strength or sustainability behind a price move. In an uptrend the A/D indicator should also be moving upwards. In a downtrend the A/D indicator should be moving downwards.
Calculation:
A certain share of the daily volume is added to or subtracted from the current accumulated value of the indicator. The nearer the closing price to the maximum price of the day is, the higher the added share will be. The nearer the closing price to the minimum price of the day is, the greater the subtracted share will be. If the closing price is exactly in between the maximum and minimum of the day, the indicator value remains unchanged.
A/D = SUM[((CLOSE — MINIMUM) — (MAXIMUM — CLOSE))*VOLUME/(MAXIMUM — MINIMUM), N]
Where:
N — the quantity of periods used in the calculation.