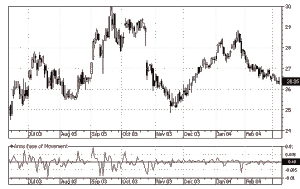
A sell signal occurs when the indicator crosses below zero. Here prices are moving downward more easily. A purchase signal occurs when it crosses above zero. In this case prices are more easily moving upward.
Low values occur when prices are moving downward on light volume. High Ease of Movement values is produced when prices are moving upward with light volume. In case if prices remain unchangeable or if heavy volume is needed to change prices, the indicator will stay near zero point.
Ease of Movement Buy Signal
Buy when the Ease of Movement indicator crosses above the zero line.
Ease of Movement Sell Signal
Sell when the Ease of Movement indicator crosses below the zero line.
As with most indicators, it is advised that a stock or futures trader use other technical analysis indicators to confirm buy or sell signals.
The formula is to Calculate Ease of Movement is as follows:
[ {(H+L)/2} – {(Hp+Lp)/2} ] / [ V/(H-L) ]
Where:
H = Today’s high
L = Today’s low
Hp = the previous day’s high price
Lp = the previous day’s low price
V = current day’s volume
The Ease of Movement indicator produces a buy signal when the indicator crosses above the zero center line, indicating that the security is moving upward easily; a sell signal is given when the indicator crosses below the zero center line, indicating that the security is moving downward easily.
High ease of movement values correspond with easy upward price movement whereas low ease of movement values correspond with easy downward price movement. When price movement is small on heavy volume, the ease of movement indicator is zero.

very useful, thanks a lot ! I have benefitted from your article
Very very interesting and useful, I have gained a lot knowledgewise and moneywise